How to Create a Financial Forecast: A Beginner's Guide
Step-by-step guide for small business owners and startup founders to build accurate financial forecasts without a finance degree.

You're about to make a critical business decision: hiring your first employee, launching a new product, or approaching investors for funding. But there's one question keeping you up at night: "Will I have enough money?"
Without a financial forecast, you're driving your business blindfolded. You might feel like everything's fine today, but what about three months from now? Six months? A year?
The good news? Creating a financial forecast isn't reserved for MBAs and finance wizards. You can build a reliable forecast that guides your business decisions, impresses investors, and helps you sleep better at night. This guide will show you exactly how.
Why Financial Forecasting Matters (And It's Not Just About Numbers)
Think of your financial forecast as a GPS for your business journey. You wouldn't drive cross-country without directions, yet many entrepreneurs run their businesses without knowing where they're headed financially.
Here's what a solid forecast gives you:
For Survival: Know exactly when you'll run out of cash before it happens. The average small business has just 27 days of cash reserves. A forecast tells you if you're about to hit that wall.
For Growth: Identify the right time to expand, hire, or invest. Should you open that second location? Your forecast will show if you can afford it.
For Funding: Investors and lenders won't even talk to you without financial projections. They want to see you've thought through the numbers.
of small businesses fail due to cash flow problems
Source: U.S. Bank Study, 2023
typical forecast period for startups
Source: Industry standard
accuracy improvement with regular forecast updates
Source: CFO Magazine, 2024
According to a U.S. Bank study, 82% of small businesses fail because of cash flow mismanagement. Most of these failures could've been prevented with basic forecasting.
Step 1: Define Your Forecasting Purpose and Time Frame
Before you touch a spreadsheet, get clear on why you're forecasting. Your purpose shapes everything else.
Common forecasting purposes:
Securing funding: Investors typically want 3-5 year projections showing growth potential and when you'll become profitable.
Internal planning: If you're planning operations and hiring, focus on the next 12-18 months with quarterly detail.
Cash management: For day-to-day operations, create a rolling 13-week cash flow forecast that you update weekly.
Strategic planning: Long-term business strategy requires 3-5 year forecasts with annual milestones.
Start Short, Then Go Long
New to forecasting? Start with a 12-month forecast broken into monthly periods. Once you're comfortable, extend to 3 years with quarterly breakdowns for years 2-3. You can always add more detail later.
Step 2: Gather Your Historical Financial Data
You can't predict the future without understanding the past. Here's exactly what you need and where to find it.
Essential data to collect:
Revenue history (minimum 12 months):
- Monthly sales by product/service line
- Customer counts and average transaction values
- Seasonal patterns and growth trends
- Revenue sources (if you have multiple streams)
Expense history (minimum 12 months):
- Fixed costs (rent, salaries, insurance, subscriptions)
- Variable costs (materials, commissions, shipping)
- One-time expenses (equipment, legal fees)
- Seasonal variations
Where to find this data:
- Accounting software (QuickBooks, Xero, FreshBooks)
- Bank and credit card statements
- Invoicing systems
- Point-of-sale systems
- Tax returns
Don't Have 12 Months of History?
If you're pre-revenue or only have a few months of data, that's okay. You'll rely more on industry benchmarks and market research (we'll cover this in Step 4). Just be transparent about your assumptions.
For a hypothetical example: Sarah runs a boutique coffee roastery. She pulls 18 months of data from QuickBooks and discovers:
- Average monthly revenue: $28,500
- Peak season (Nov-Dec): 40% higher sales
- Fixed monthly costs: $12,000
- Variable costs: 35% of revenue
This historical baseline becomes the foundation for her forecast.
Step 3: Identify Your Key Business Drivers
Business drivers are the critical factors that directly impact your revenue and expenses. Identifying these helps you build a forecast that actually reflects how your business works.
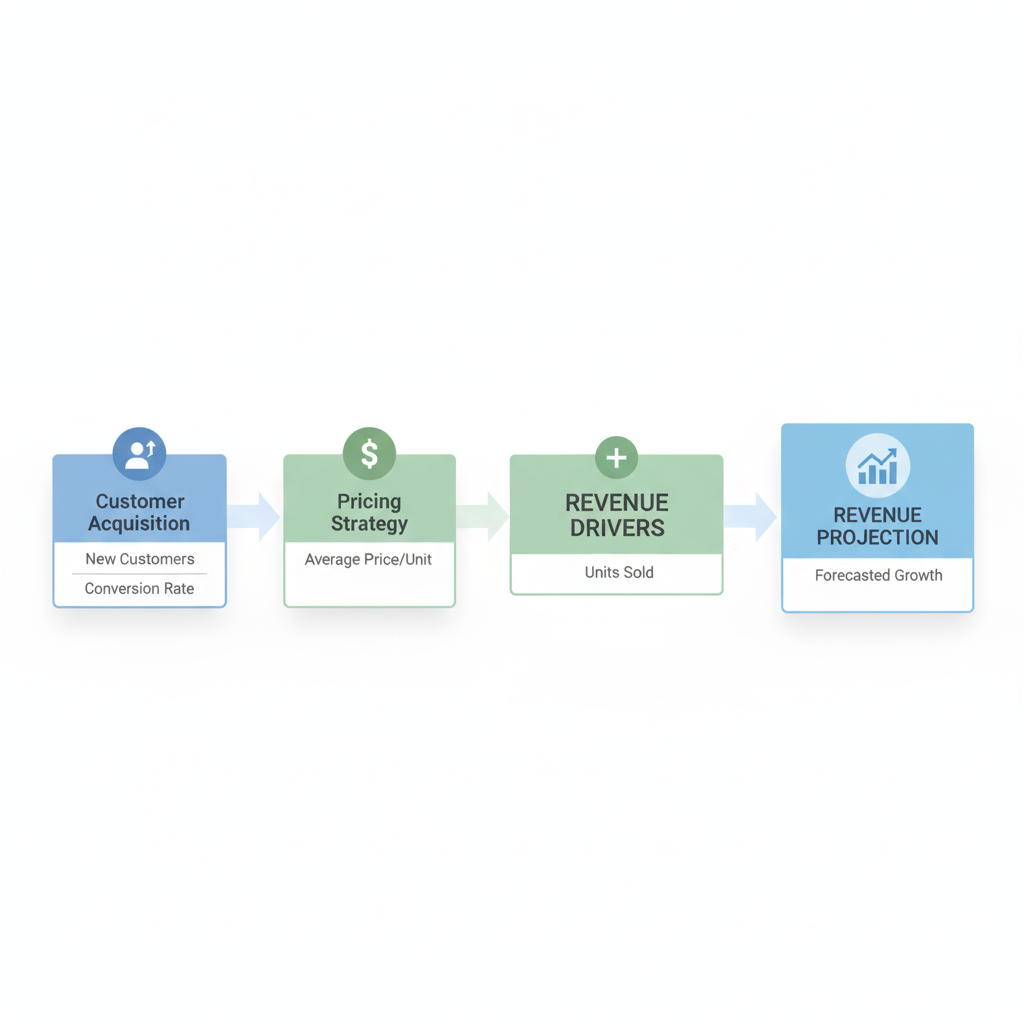
Common revenue drivers:
For retail: Customer traffic × conversion rate × average purchase value For SaaS: Monthly recurring revenue (MRR) × churn rate + new customer acquisition For services: Billable hours × hourly rate × utilization rate For e-commerce: Website visitors × conversion rate × average order value
Common expense drivers:
Production costs: Often tied to revenue (e.g., 35% of sales) Labor costs: Tied to headcount and wages Marketing costs: Often budgeted as percentage of revenue (5-15%) Rent and overhead: Usually fixed monthly amounts
Example: A marketing agency identifies their key drivers:
- Revenue driver: Number of active clients × average monthly retainer ($3,500)
- Expense driver: Team size (each team member costs $75K annually fully loaded)
- Growth assumption: Add 2 new clients per month, hire 1 person per quarter
These drivers let them model scenarios like "What if we land 3 clients per month instead of 2?"
Step 4: Choose Your Forecasting Method
There are two main approaches, and most businesses use a combination.
Quantitative Methods (Data-Driven)
Trend analysis: Project past growth rates forward. If your revenue grew 15% annually for the past 3 years, assume 15% growth going forward (adjusted for market conditions).
Moving averages: Average your last 3-6 months of data to smooth out fluctuations and identify trends.
Best for: Established businesses with consistent historical data.
Qualitative Methods (Judgment-Based)
Market research: Use industry reports and competitor data to estimate market size and your potential share.
Expert input: Consult industry veterans, advisors, or similar business owners for realistic benchmarks.
Top-down approach: Start with total addressable market, estimate your market share, then calculate revenue.
Best for: Startups, new product launches, or rapidly changing markets.
Quantitative vs Qualitative Forecasting
| Feature | Quantitative (Data-Driven) | Qualitative (Judgment-Based) |
|---|---|---|
| Best For | Established businesses | Startups & new ventures |
| Data Requirements | 12+ months of history | Industry research & benchmarks |
| Accuracy | Higher for stable businesses | More assumption-based |
| Time to Create | 2-4 hours | 4-8 hours (includes research) |
| Flexibility | Less adaptable to change | Easier to adjust assumptions |
Recommended approach: Start with quantitative data (if you have it), then layer in qualitative insights about market changes, competitive threats, or growth initiatives.
Skip the Spreadsheet Headaches
Modern forecasting tools do the heavy lifting so you can focus on growing your business
Try MyFuture Finance FreeStep 5: Build Your Revenue Forecast
Now we get to the heart of forecasting. Here's how to project your revenue month by month.
Start with your baseline:
- Take your most recent month's revenue as Month 1
- Apply your growth rate for subsequent months
- Adjust for seasonality based on historical patterns
Example: E-commerce store revenue forecast
Current monthly revenue: $45,000 Growth rate: 5% per month Seasonal boost: +30% in November, +50% in December
Month-by-month projection:
- January: $45,000 (baseline)
- February: $47,250 (5% growth)
- March: $49,613 (5% growth)
- April: $52,094
- May: $54,698
- June: $57,433
- July: $60,305
- August: $63,320
- September: $66,486
- October: $69,810
- November: $90,753 (5% growth + 30% seasonal boost)
- December: $111,315 (5% growth + 50% seasonal boost)
Total Year 1: $767,077
Breaking Down by Revenue Stream
If you have multiple products or services, forecast each separately:
Coffee roastery example:
- Wholesale accounts: $18,000/month, growing 3% monthly
- Retail online: $8,500/month, growing 8% monthly
- Cafe sales: $2,000/month, growing 2% monthly
This granular approach helps you identify which revenue streams deserve more investment.
Step 6: Project Your Expenses
Expenses fall into two categories, and you need to forecast both.
Fixed Expenses (Stay the same regardless of sales)
Monthly fixed costs to include:
- Rent/lease payments
- Insurance premiums
- Software subscriptions
- Salaries (for salaried employees)
- Loan payments
- Professional services (accounting, legal)
Example fixed costs:
- Rent: $3,500/month
- Insurance: $450/month
- Software: $800/month
- Salaries: $12,000/month
- Total fixed: $16,750/month
Variable Expenses (Scale with revenue)
Common variable costs:
- Cost of goods sold (COGS): Raw materials, inventory
- Hourly labor: Scales with production/sales volume
- Credit card processing fees: Typically 2.5-3% of revenue
- Shipping costs: Tied to order volume
- Commissions: Percentage of sales
Example variable costs (for $50,000 monthly revenue):
- COGS: 35% of revenue = $17,500
- Processing fees: 2.7% of revenue = $1,350
- Shipping: 4% of revenue = $2,000
- Commissions: 5% of revenue = $2,500
- Total variable: $23,350
Don't Forget Growth-Related Expenses
As you scale, you'll need to add:
- New hires (plan 2-3 months ahead of when you'll need them)
- Additional equipment or inventory
- Increased marketing spend
- Larger office space
Common Mistake: Forgetting Tax Liability
Many forecasts overlook tax obligations. Set aside 25-35% of net profit for federal, state, and local taxes. Missing this can create a cash crisis at tax time.

Step 7: Create Pro Forma Financial Statements
Your forecast should produce three key financial statements:
1. Income Statement (Profit & Loss)
Shows revenue minus expenses = net income
Basic format:
Revenue:                     $50,000
- Cost of Goods Sold:       ($17,500)
= Gross Profit:              $32,500
- Operating Expenses:       ($16,750)
= Operating Income:          $15,750
- Interest/Taxes:            ($4,725)
= Net Income:                $11,025
2. Cash Flow Statement
Shows actual cash movement (critical because profit ≠ cash)
Key sections:
- Operating activities (revenue collected, expenses paid)
- Investing activities (equipment purchases, asset sales)
- Financing activities (loans received, debt payments)
3. Balance Sheet
Shows assets, liabilities, and equity at a point in time
Simple format:
Assets:
  Cash:                      $45,000
  Accounts Receivable:       $28,000
  Inventory:                 $35,000
  Equipment:                 $60,000
  Total Assets:             $168,000

Liabilities:
  Accounts Payable:          $18,000
  Loans:                     $40,000
  Total Liabilities:         $58,000

Equity:                     $110,000
Focus on Cash Flow First
If you're new to forecasting, prioritize cash flow over profit. A profitable business can still fail if it runs out of cash. Track when money actually comes in and goes out, not just when you earn or owe it.
Bonus: Tools and Software That Make Forecasting Easier
You don't need fancy software to start, but these tools can save you hours:
Spreadsheet-based (Free to start):
- Google Sheets: Free, collaborative, with templates available
- Excel: Powerful but steeper learning curve
- Template libraries: SCORE.org offers free financial templates
Dedicated forecasting software ($):
- MyFuture Finance: Automated forecasting with real bank connections ($4.99-19.99/month)
- LivePlan: Business planning focused, great for investor presentations ($20/month)
- ProfitWell: Best for SaaS businesses (free basic tier)
- Float: Cash flow forecasting specialist ($49/month)
Accounting software with forecasting:
- QuickBooks: Built-in forecast features with accounting data integration
- Xero: Good forecasting add-ons available
- Wave: Free accounting with basic projections
Automate Your Forecasting in Minutes
Connect your bank accounts and let MyFuture Finance build accurate forecasts automatically. No spreadsheets required.
Start Free TrialCommon Pitfalls to Avoid
Even experienced entrepreneurs make these forecasting mistakes:
1. Being too optimistic with revenue Many first-time forecasters assume linear growth that never materializes. Be conservative. It's better to exceed a cautious forecast than miss an aggressive one.
Reality check: If you project 100% year-over-year growth, explain exactly how you'll achieve it. What marketing channels? How many salespeople? What's the conversion data?
2. Underestimating expenses Costs always exceed expectations. Add a 10-15% buffer to your expense projections.
3. Ignoring working capital needs You need cash to buy inventory before you can sell it. Many businesses underestimate how much cash they'll need tied up in operations.
4. Forgetting about timing Your forecast might show $50,000 revenue in March, but if customers take 45 days to pay, that cash doesn't arrive until May. Model payment terms realistically.
5. Set it and forget it A forecast isn't a one-time exercise. The best forecasts are living documents updated monthly with actual results.
6. Overly complex models Your first forecast should be simple. You can add sophistication later. A simple forecast you actually use beats a complex one you abandon.
When to Update Your Forecast
Your forecast loses value if it's not current. Here's when to refresh it:
Monthly (minimum): Update with actual results and adjust future months based on what you learned. This is called a "rolling forecast."
Quarterly: Conduct a deeper review. Are your assumptions still valid? Has the market changed? Do you need to revise your growth rate?
When major changes occur:
- Securing new funding
- Launching a new product
- Losing a major client
- Economic shifts affecting your market
- Hiring key team members
Best practice: Create a simple routine. Every month on the 5th (after closing last month's books), spend 1-2 hours updating your forecast with actuals and adjusting the next 3-6 months based on new information.
Your Forecast Is a Living Document
Creating a financial forecast might seem daunting at first, but remember: done is better than perfect. Your first forecast won't be accurate, and that's okay. The goal isn't perfection—it's having a structured way to think about your financial future.
Think of forecasting like learning to ride a bike. You'll wobble at first. You might fall a few times. But with practice, it becomes second nature. Soon you'll wonder how you ever ran your business without it.
Quick recap of the 7 steps:
- Define your purpose and time frame
- Gather 12+ months of historical data
- Identify your key business drivers
- Choose quantitative and/or qualitative methods
- Build your revenue forecast month by month
- Project fixed and variable expenses
- Create pro forma income statement, cash flow, and balance sheet
Start simple. Use what you have. Update regularly. Your forecast will improve over time as you learn what works for your specific business.
The businesses that thrive aren't necessarily the ones with the best products or the biggest marketing budgets. They're the ones that see financial problems coming months before they arrive—and have time to fix them.
That's the power of forecasting. It turns uncertainty into actionable plans. It transforms hope into strategy. And it gives you the confidence to make the big decisions that grow your business.
Ready to Build Your Financial Future?
Join thousands of entrepreneurs using MyFuture Finance to forecast with confidence. Connect your accounts and see your financial future in minutes—no finance degree required.
Get Started FreeMichael Chen
Business Planning Consultant
Former startup CFO who helped 50+ early-stage companies secure funding through better financial planning. Now teaches entrepreneurs to master their numbers without the jargon.